
Solar PV - What can you expect
Here in the UK we are used to rain and cloudy days. With this is mind we are attempting to shed some light on the question – Is solar sensible in the UK and what can you expect?
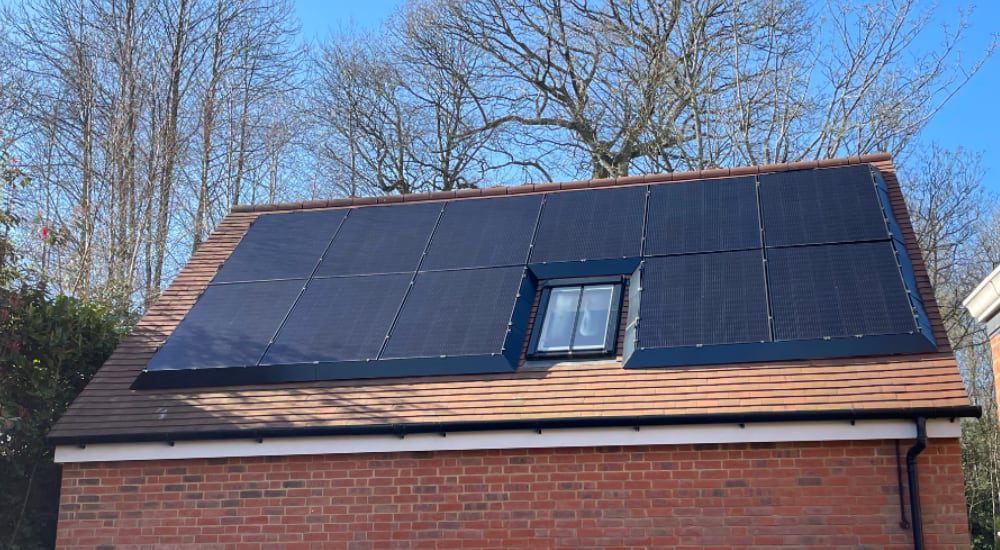
Instalation
We installed an 11 PV array in Oct 2022 along with a 10 Kwh Solar Edge battery and inverter. The site was commissioned on the last day of October 2022 with the electric generation on Nov 1st 2022.
The Solar Edge system includes an App and web portal to show current conditions and past performance. It is a great little app and has worked flawlessly on iPhone and on web browsers.
Battery storage doubled to 20 kWh in April 2024.
Graphical data for 2023 and 2024 below.
Solar Edge Referal
You should give it a try.
https://referral.solaredge.com/en?ref=0GE8AJ-UFKDET
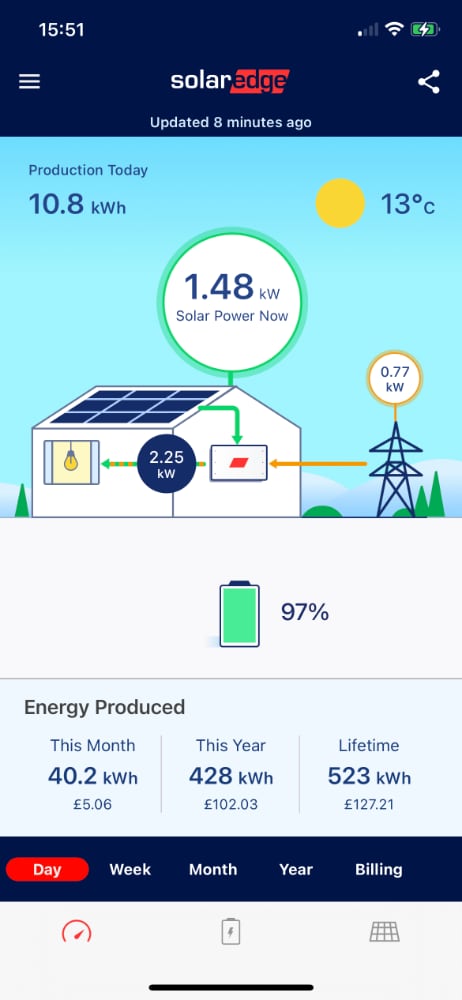
This screen shot taken on April 3rd shows the Solar Power being generated is 1.48kW and the battery in 97% charged. The house is using 2.25kW with the source showing as solar 1.48 and 0.77 from the Grid.
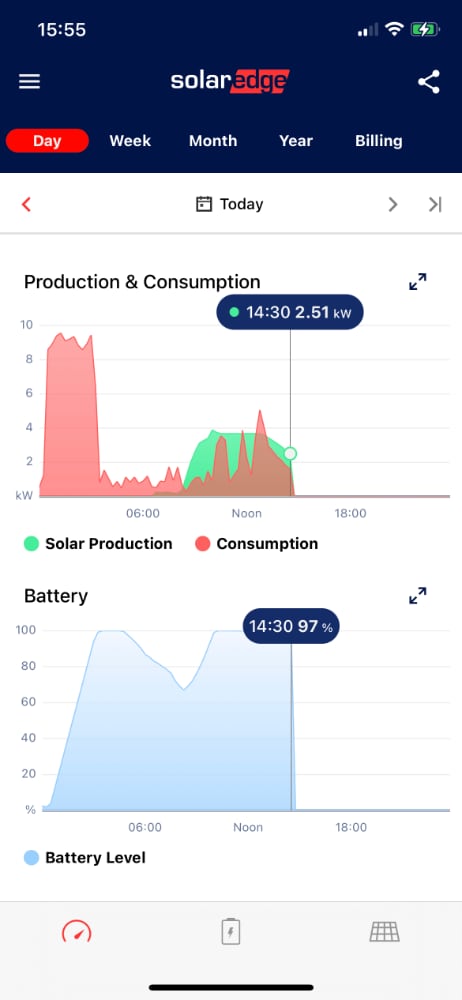
The screen shot below shows the state of the battery charge and the consumption and production for the day so far.
The battery starts charging at 00:30 and the blue charge level ramps us and if full by around 04:00. The battery stops charging at 04:30 when the Octopus Go night rate ends and the house switches to 100 % Battery power and 0% grid.
As the day progresses the battery is depleted until around 09:30 it has fallen to 65% and then the sun starts to charge the battery back up as the solar energy is more then the power used by the house. By 11:15 the battery is full and at the 100% mark. With a full battery we increased the home consumption shows as red in the chart below by turning on the immersion heater and then the EV charger. In this case toping up the Outlander PHEV battery.
Power Generation Results 2023-2026
Year at a glance
Our 4.46 kWp SolarEdge system, installed October 2022. Figures in kWh from SolarEdge monitoring.
| Year | Total kWh | Best month | vs previous year |
|---|---|---|---|
| 2023 | 3,821 | Jun – 603 | – |
| 2024 | 3,450 | Jun – 512 | -10% |
| 2025 | 4,260 | Jul – 534 | +23% |
| 2026 (Jan–Sep) | 3,987 | Jul – 635 | +10% (same months) |
Month by month
Click a figure to read that month's post.
Power Generation for 2026
Solar generation 2026
Monthly production in kWh (year to date) – total 3,987 kWh. Peak month highlighted; hover a bar for its value.
This shows how sunny Jan and Feb 2026 were with production above prior years as was April with 576 KWh compared to 505 kWh in 2025. May seems another sunny month after a minor heat wave we produced 587 kWh of solar power. June and July continue the string sun with July producing 635 kWh, the most of any month ever!
Power Generation Results 2025
Solar generation 2025
Monthly production in kWh – total 4,260 kWh. Peak month highlighted; hover a bar for its value.
This shows how gloomy Jan and Feb 2025 were with only 55 kWh produced Feb and zero in January. March 2025 with sun most days produced 375 kWh of power. April jumps to over 500 kWh. May and June both reasonable with close to 500 kWh but both less than sunny April.
Power Generation Results 2024
Solar generation 2024
Monthly production in kWh – total 3,450 kWh. Peak month highlighted; hover a bar for its value.
This shows how gloomy Feb 2024 was with only 76 kWh produced. This is well below the 148 kWh that was generated Feb 2023.
March 2024 less grey with a number of sunny days to product 242 KWH of power. April, as expected has more sunshine than March and resulted in 337 kWh of power produced. May continued the growth with 425v kWH of power generated. June saw increasing production and July a slight dip in output. August was more in line with the seasonal average and close to the 2023 output.
September was well below average and substantially lower than 2023.
October 2024, again another dismal month for solar production, just 125 kWh produced, around half of 2023.
November may be the least Sunny November ever recorded with just 50KWh of power produced. This is more in line with a bad December. This December was super cloudy with just 17kw produced.
Chart below shows production for 2023 and 2024 and highlights that production fell from 3.4Mwh to 2.83MWh in 20204.
Solar generation 2023
Monthly production in kWh – total 3,821 kWh. Peak month highlighted; hover a bar for its value.
This shows how gloomy March was as month with only 10 kWh more the Feb. On a per day basis March was only a fraction more than Feb with 5.126 compared to 5.110 kWh per day.
April is more like the expected generation with close to 400 kWh produced.
May is more is line with the expectations.
June was exceptionally sunny and longer days helped production to 581 kWh. July was more of the expected British summer with plenty of rain and cloud resulting in solar production of only 405 kWh or around 13 kWh per day. July and August continued with below expectations of sun with both months producing just over 400 kWh. September slightly above expectations and generating over 360 kWh of power. October was rather wet and cloudy with 235 kWh produced. November more cloud and rain producing just under a 100 kWh, however slightly more than November 2022 that produced just 73 kWh. December managed just a few hours of sunshine with a total production of 18 kWh. Dismal.
Total for the year stands at 3.43 MWh of electricity.


Battery Storage Doubled
Our friends from Bright Spark installed a second Solar Edge 10 kWH battery pack bringing our total storage to 20 kWh.
We will see how this performs over the coming month. The idea is to charge at night with the Octopus rate and then keep the pack full from the sun and export any surplus back to the grid and the remaining power should keep the office and house running for the rest of the day with little or no grid feed in power.
